Giza Ground Truth: Magnetic Anomaly Surveying
By Glen Dash
At Giza we face such an enormous task in trying to determine the
footprint of the Old Kingdom complex that Glen Dash, one of our supporters
and an expert in remote sensing, suggested magnetic anomaly surveying as
another method for locating structures. Glen joined us this past winter
to test the technique. – Mark Lehner
The sand movers had finally done their job. I was now standing
on clean sand, on a layer which just days before was two meters below the
surface. The Giza Plateau Mapping Project was moving outward from
its home base in what we call Zone C. My assigned task was to magnetically
map an area which was off of our charts. Our survey map (see Figure 1) extended as far north and west as square
R4. This day I'd be working in a square without a name. We had
run out of numbers.
I had near perfect conditions for using magnetic gradiometry which measures
small perturbations in the earth's magnetic field. Iron is one of
the most plentiful substances in the earth's crust, and most every bit of
iron, to one degree or another, perturbs the earth's magnetic field.
Some materials, such as limestone and sand, produce little perturbation.
Others, like fired pottery, produce surprisingly strong magnetic fields
and, if massive enough, can be detected a meter away.
Modern Debris Wreaks Havoc
Magnetic survey is not easy. It's made difficult, in part, by
the effects of modern man on his environment. We drop little bits of
metal everywhere. On the surface of the Giza Plateau there are horseshoes,
rusted pots and pans, bottle caps, and even truck parts. We dug up
all of those things during our spring 2000 season. Bits of manmade forged
or cast iron serve to concentrate the earth's magnetic field intensely.
In fact, they will mask any archaeological features for a distance of a
meter or more. Scatter enough horseshoes, nails, bottle caps, and pots
and pans around a site and you'll see nothing of the ancient architecture.
Initially, I had signed on to work in Zone W (for west) and had attempted
to map magnetic anomalies without removing the top few feet of sand which
contains all this modern debris. In one 20 x 20-meter square I located
and removed ten pounds of junk metal, including 20 horseshoes. In
an adjacent square, slightly lower in elevation than the first, it was pots
and pans. Still farther to the north and west, a 20 x 20-meter square
revealed hundreds of bottle caps. I could discern the modern occupation
patterns from the junk I was finding.
A Fresh Start
This new area that I was assigned, however, was just cleared by the
bulldozers. They had pulled away a good two to three meters of the
sandy overburden and, at the same time, removed all the modern metal (including
what looked like the front end of a tractor). The surface I was standing
on now had been deposited here some time between 500 and 2500 BCE.
We know that because it was below the level of nearby Late Period burials
(circa 500 BCE), but above the Old Kingdom architecture. Lighter in
color than the sand on the surface, it was pristine and uniform, indeed,
quite beautiful. The Old Kingdom architecture was still probably one
or two meters beneath my feet. Nothing on the surface gave a clue as
to what might lie below.
Surveying
To start, we laid out a square 5 x 10 meters (Figure
3). Our ever efficient surveyor, David Goodman, had already put
metal rebar on one end of the square, but I had managed to get there before
he had done the same to the other. I placed plastic pegs at that end
of the square and laid out tapes, forming two tracks, one meter apart.
Each fiber glass tape was marked with a distinctive red marking every meter.
Once tapes were in place, mapping went speedily.
The instrument I was using, the FM36, was built by Geoscan Research.
Unlike other magnetometers and magnetic gradiometers, this one had been
designed specifically with archaeology in mind. Even though the design
was old (circa 1985), it was still the best instrument for the job.
Taking Readings
I began by standing near the southwest portion of the grid square.
Flipping the magnetometer on, it started taking readings -- four a second.
The job of the surveyor is to walk steadily and to make sure that the gradiometer
is aligned with the red markings on the tape each time the instrument beeps,
denoting another one-second interval. (See Figure 2.)
As I reached the end of the square, the gradiometer stopped beeping
(it knows that this is 5 x 10 meter square). Then I walked back to
the southern end of the square and repeated the process, this time walking
between the two tapes, which were placed one meter apart. I repeated
this process again and again, periodically stopping to move the tapes along
the 5-meter breadth of the square.
Suspense: Downloading
It is not really possible to get an indication of what the instrument
is finding by watching its readings as one walks along. There is
just too much information. So there is a moment of suspense when it
is time to download a day’s worth of data into a computer so it can be observed.
The suspense is heightened by the fact that the 15-year-old serial communication
technology used in the FM36 is incompatible with the serial input port of
newer computers. A practical alternative is to use an old computer
for downloading data. I used an old Toshiba Satellite laptop based
on Intel 286 technology.
I brought the FM36 back to the storage tent. It provided shade
and a table for the computer and the FM36. The FM36's shipping case
served as a chair. Hooking the serial output port of the instrument
to the serial input port of the laptop and firing up, Geoscan Research's
"Geoplot" software got me to the download screen. Setting the input
parameters, I pressed download and prayed that, today, the two machines
would talk to each other.
They did. I pressed a few more buttons and a 5 x 10-meter scale map
appeared on the screen. What appeared was without a doubt evidence
of an Old Kingdom structure (Figure 4). This established
that the AERA site extended far beyond the area that we had been excavating,
right up to the base of the Wall of the Crow.
Moment of Truth
Reis Ahmed's crew was now assigned the task of removing the clean sand
above the feature I had detected. I climbed atop of the Wall of the
Crow, 10 meters to the north, to watch. One foot of sand was removed,
then two, then three, revealing nothing. But something had
to be there. I stayed despite the increasingly skeptical look on the
Reis Ahmed’s face.
Almost a meter and a half down, the edges of a structure emerged. With
a bit more excavation, we could identify it. It appeared to be either
a bakery or the area immediately adjacent to one. The strong magnetic
signatures were caused by dozens of bread moulds used and discarded here.
They had piled up against the walls of a building, along with other pottery.
Using Magnetometry
My visit to the pyramids was as much to study magnetometry as it was
to study archaeology. Every site has unique characteristics, and it sometimes
can take considerable time and effort to determine what conditions will
produce useful results. Here at the Giza Pyramids magnetometry can be a
powerful and very revealing technique. The key is to strip off the modern
layers, layers which are contaminated with modern metal. Once you reach
a depth that precedes the Iron Age, there should be no refined iron to cause
interference. (It would also help if archaeologists found some other
way to stake the corners of their squares than to use iron rebar.)
Finding Ghosts
We also mapped a number of grid squares in Zone C itself, demonstrating
another use for magnetic anomaly surveying here. In square O-14 we
found that we could identify where walls, now gone, once stood.
A system of long and substantial gallery walls had been observed running
through Zone C from north to south. One of the gallery walls should
have run through the western corner of this square, but nothing was found.
A careful gradiometer run revealed the reason. The gallery wall had
been there. In ancient times, pottery had piled up against the wall and
its former location was now revealed by the dark pattern running through
the center of O-14 in Figure 5. Sometime
in the ancient past the mud brick gallery wall had been robbed or eroded
away, possibly by floods which had destroyed much of the architecture in
the north and eastern sections of Zone C. The heavier pottery remained,
marking the eastern edge of the gallery wall, which was now a "ghost" wall.
Although the wall was gone, its location is still readily observable with
magnetic anomaly analysis.
Remote Sensing in 2001
I will return to the Giza Plateau in the spring of 2001, armed not only
with our magnetic gradiometer, but with ground penetrating radar.
How I will use these instruments I really can't say. As with magnetometry,
it will take a week or so of experimentation to determine how to get the
most out of the instruments. But as our experiment in magnetometry
has shown, these instruments indeed can provide a valuable data set to compliment
the information obtained through more traditional means.
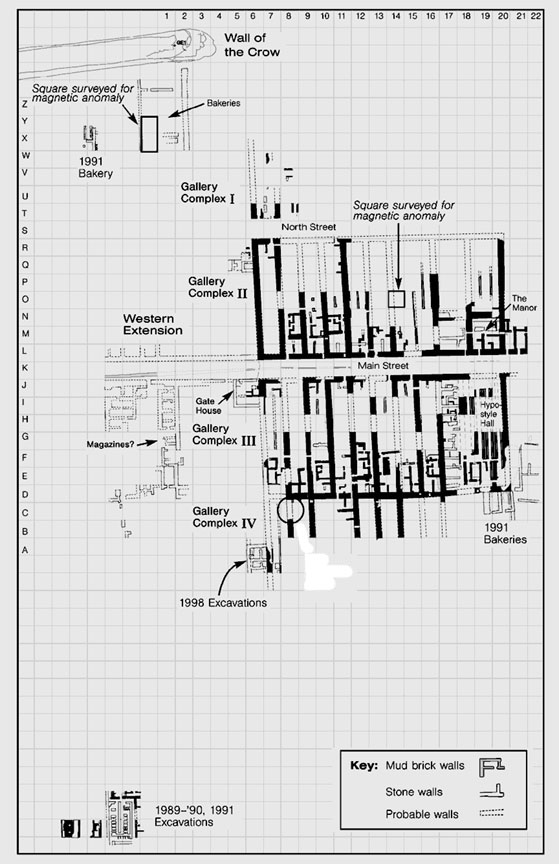 Figure 1
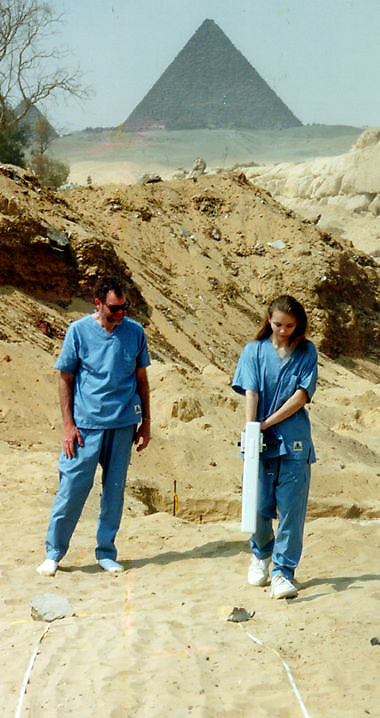
Figure 2: Gradiometer survey in progress. Becky
Dash operates the FM 36 gradiometer while Glen Dash watches. Both
had to wear surgical scrub suits because the magnetic anomalies were so
weak, on the order of 1/10,000th of the earth’s magnetic field.
These clothes have no metal that could interfere with the survey.
Menkaure's Pyramid rises in the background. At the right the
west end of the Wall of the Crow disappears under the sand.
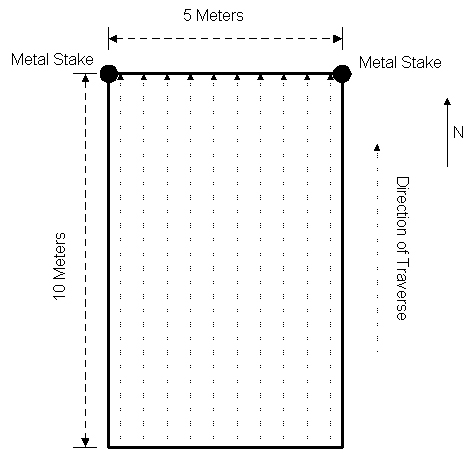 Figure 3: At Giza, we used traverse lines one-half meter apart
and 10 meters long, taking 40 readings along each traverse.
Figure 3: At Giza, we used traverse lines one-half meter apart
and 10 meters long, taking 40 readings along each traverse.
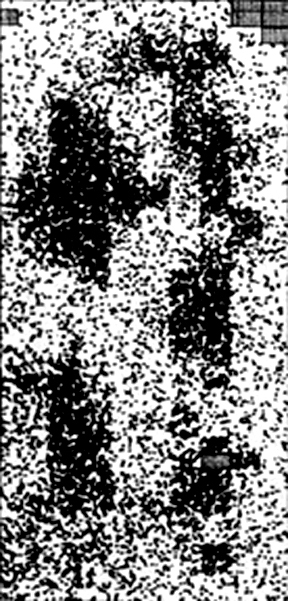
Figure 4: Results of the gradiometer survey
for the survey area. The darker areas have relatively greater magnetic
field deflection. The north-south alignment and the spacing of the
anomalies indicate the presence of an Old Kingdom structure of some kind.
The right hand corners, where the metal stakes were located, could not be
surveyed because their metal masks any magnetic anomalies. The areas that
were untestable are indicated by the grid-paper like pattern.
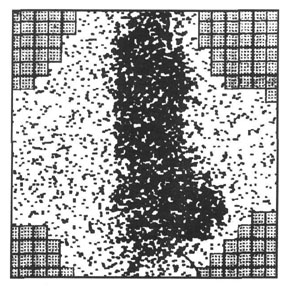
Figure 5: Gradiometer results for square O-14.
The dark areas denote buried sherds. The lighter area to the left
is where a gallery wall once stood before it was robbed or eroded away.
The heavier sherds remained where they had piled up against the wall, and
now indicate where the "ghost wall" once stood. The squares that
look like grid-paper are areas that could not be surveyed because of the
presence of metal, primarily metal stakes, which masks magnetic anomalies.